Visualizing datasets on ALGOGENE Research Lab is extremely simple. This articles shows you how to apply a popular Python charting library 'matplotlib' to acheive this. With 'matplotlib', you can create and customize various charts in Python. Here is the official document https://matplotlib.org/ to explore what kind of charts available.

Before we go into the example, let's go back a little bit to ALGOGENE's cloud environment structure. When you create an ALGOGENE account, you will be automatically assigned with a partition of computing resources including disk storage, random assess memory, etc. All your backtest, livetest or real-trading scripts will be encrypted and execute on your dedicated environment separately and independently. If you want to display some customized calculation results (eg. charts), it is necessary to dump the "data" to your assigned directory first. Then, ALGOGENE Web Server would be able to pull the results and display to frontend interface.
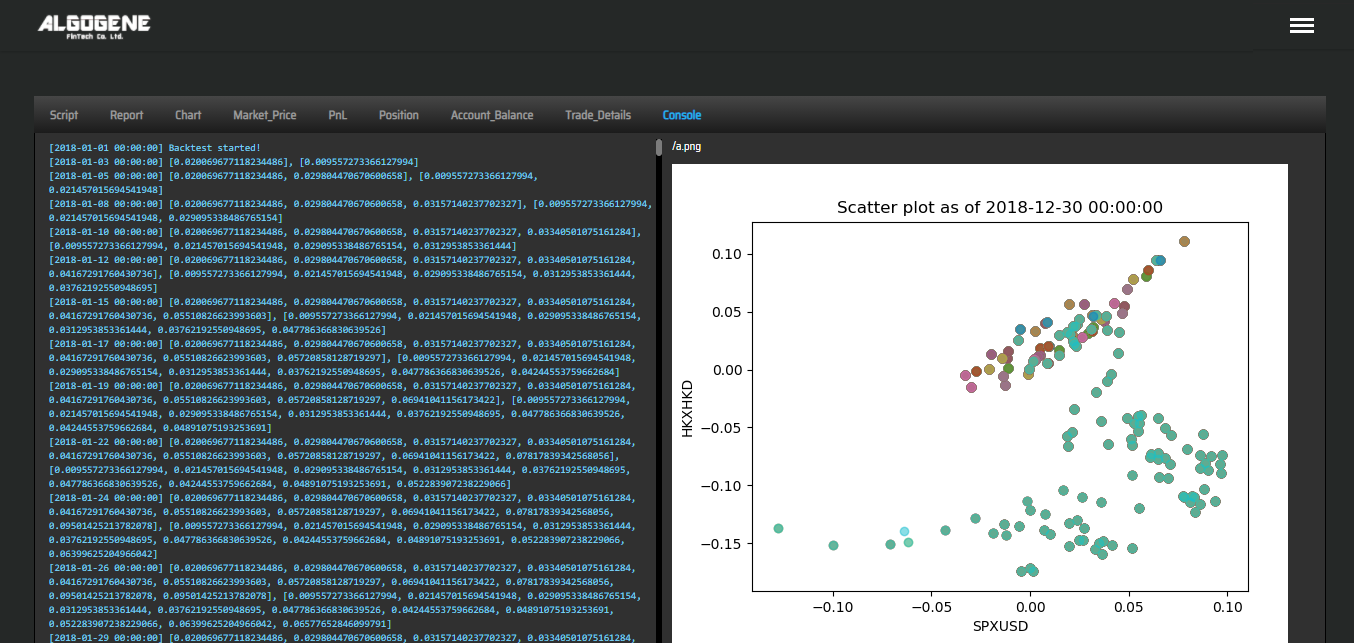
In the following, suppose we are interested to visualize the dispersion of daily return between 2 instruments. On ALGOGENE Backtest environment, we choose S&P500 and Hang Seng Index as an example. Now, an important step is to save the charts to our assigned image directory, i.e. self.evt.path_img specified at line 32 below. That's it!
Full Source Code
1 2 3 4 5 6 7 8 9 10 11 12 13 14 15 16 17 18 19 20 21 22 23 24 25 26 27 28 29 30 31 32 33 34 35 36 37 38 39 40 41 42 43 44 45 46 47 48 49 50 51 52 53 54 55 56 57 58 59 60 | from AlgoAPI import AlgoAPIUtil, AlgoAPI_Backtest from datetime import datetime, timedelta import matplotlib.pyplot as plt class AlgoEvent: def __init__(self): self.lasttradetime = datetime(2000,1,1) self.arrSize = 100 self.last_price_X = 0 self.last_price_Y = 0 self.arr_return_Y = [] self.arr_return_X = [] def start(self, mEvt): self.myinstrument_Y = mEvt['subscribeList'][0] self.myinstrument_X = mEvt['subscribeList'][1] self.evt = AlgoAPI_Backtest.AlgoEvtHandler(self, mEvt) self.evt.start() def on_bulkdatafeed(self, isSync, bd, ab): if isSync: # get new day price if bd[self.myinstrument_Y]['timestamp'] > self.lasttradetime + timedelta(hours=24): self.lasttradetime = bd[self.myinstrument_Y]['timestamp'] # calculate daily return if self.last_price_X>0 and self.last_price_Y>0: self.arr_return_Y.append(bd[self.myinstrument_Y]['lastPrice']/self.last_price_Y - 1) self.arr_return_X.append(bd[self.myinstrument_X]['lastPrice']/self.last_price_X - 1) # print observation self.evt.consoleLog(self.arr_return_Y, self.arr_return_X) # plot chart plt.scatter(self.arr_return_X, self.arr_return_Y, alpha=0.5) plt.title('Scatter plot as of '+str(self.lasttradetime)) plt.xlabel(self.myinstrument_X) plt.ylabel(self.myinstrument_Y) plt.savefig(self.evt.path_img+"a.png") else: self.last_price_X = bd[self.myinstrument_X]['lastPrice'] self.last_price_Y = bd[self.myinstrument_Y]['lastPrice'] # keep array size = 100 if len(self.arr_return_Y)>self.arrSize: self.arr_return_Y = self.arr_return_Y[-self.arrSize:] if len(self.arr_return_X)>self.arrSize: self.arr_return_X = self.arr_return_X[-self.arrSize:] def on_marketdatafeed(self, md, ab): pass def on_orderfeed(self, of): pass def on_dailyPLfeed(self, pl): pass def on_openPositionfeed(self, op, oo, uo): pass |
Console Result