
What is Relative Strength Index?
The relative strength index (RSI) is a technical indicator for financial market analysis. By measuring the magnitude of recent price changes, it evaluates the over-bought or over-sold conditions of a stock or other financial instruments.
RSI is classified as a momentum oscillator, where.
- Momentum refers to the rate of the rise or fall in price
- Oscillator means its value always moves between two extremes (i.e 0 to 100 for RSI)
The relative strength index was originally developed by J. Welles Wilder and published in a 1978 book, "New Concepts in Technical Trading Systems". Nowadays, it has become one of the most popular oscillator indicators in technical analysis.
Calculation
First, we defined 2 series {Ut} and {Dt} representing the upward and downward price changes respectively. For t = 1,2,3,...
If Closet - Closet-1 >= 0,
- Ut = Closet - Closet-1
- Dt = 0
If Closet - Closet-1 < 0,
- Ut = 0
- Dt = Closet-1 - Closet
Now, an averaging function AVG(.) is applied to {Ut} and {Dt} to derive the n-period average. There are 2 commonly used averaging functions:
- Simple Moving Average (SMA) - a rolling mean on the past n observations.
- Exponential Moving Average (EMA) - all historical observations are exponentially weighted
The ratio of these averages is the relative strength:
The relative strength index is then computed as:
Interpretation
An RSI reading of 70 or above is usually interpreted as a financial instrument is becoming overbought or overvalued, which may indicate a trend reversal or corrective pullback in price in the near future. An RSI reading of 30 or below could be interpreted as an oversold or undervalued condition.
As seen from above formula, if a stock keep rising, we will get a zero sequence of {Dt}. Hence AVG(D,n) will be zero and the RS value will approach infinity, so that the resulting RSI will approach 100. As a result, this stock is said to be overbought.
RSI Implementation
There is a technical analysis python package 'ta-lib' that provides the RSI computation.
1 2 3 | import talib _in = [...] _out = talib.RSI(_in, _n) |
On the other hand, as the RSI computation is not too complicated, it is also a good exercise to implement the code on our own.
1 2 3 4 5 6 7 8 9 10 11 12 13 14 15 16 17 18 19 20 21 22 23 24 25 26 27 28 29 30 | def RSI(data, n, isEMA=True): m = len(data)-1 k = 1/float(n) RSI = [None]*m # error handling for insufficient data if m<n: return RSI # compute 1 step price difference delta = [data[i+1]-data[i] for i in range(0,m)] # create the positive gains (up) and negative gains (down) series gain = [abs(i) if i>0 else 0 for i in delta] loss = [abs(i) if i<0 else 0 for i in delta] avg_gain = sum(gain[0:n])/float(n) avg_loss = sum(loss[0:n])/float(n) for i in range(n,m): # Exponential Moving Average if isEMA: avg_gain = gain[i]*k + avg_gain*(1-k) avg_loss = loss[i]*k + avg_loss*(1-k) # Simple Moving Average else: avg_gain = (avg_gain*n - gain[i-n] + gain[i])*k avg_loss = (avg_loss*n - loss[i-n] + loss[i])*k # calculate RSI value if avg_loss==0: RSI[i] = 100.0 else: RSI[i] = 100.0 - (100.0 / (1.0 + avg_gain/avg_loss)) return RSI |
Example
Suppose we have 100 observations of daily closing prices, and we are interested in calculating a 14-day RSI.
10, 10.1, 9.92, 9.89, 9.19, 8.5, 8.96, 8.04, 7.67, 8.6, 8.72, 9.14, 10.03, 10.79, 11.39, 11.71, 11.1, 12.05, 11.21, 11.5, 12, 12.53, 12.59, 13.53, 12.87, 13.27, 13.72, 13.3, 13.88, 14.17, 14.77, 14.15, 13.75, 14.51, 13.57, 12.57, 13.02, 13.21, 12.41, 12.28, 11.41, 12, 11, 10.81, 10.07, 9.9, 9.77, 10.48, 11.38, 10.46, 10.28, 10.3, 10.78, 11.49, 12.27, 12.59, 12.74, 12.08, 11.19, 12.07, 13, 13.87, 13.15, 12.91, 13.19, 13.17, 12.24, 12.35, 12.43, 12.75, 11.97, 12.93, 13.73, 13.33, 13.74, 13.54, 14.23, 13.41, 12.52, 13.34, 14.06, 14, 13.83, 14.32, 15.18, 15.08, 14.86, 13.99, 13.48, 12.89, 13.17, 14.16, 13.5, 13.27, 13.62, 13.69, 13.4, 12.74, 13.09, 13.96
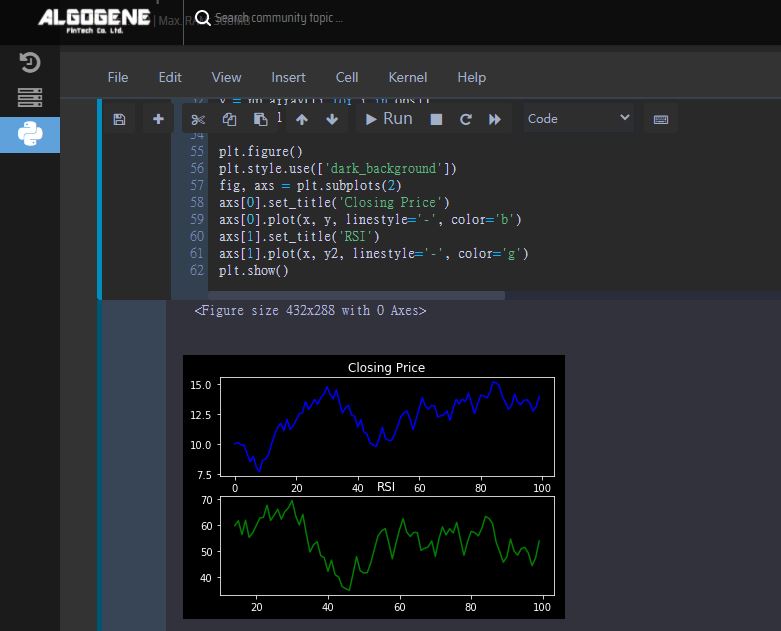
1 2 3 4 5 6 7 8 9 10 11 12 13 14 15 16 17 18 19 20 21 22 23 24 25 26 27 28 29 30 31 32 33 34 35 36 37 38 39 40 41 42 43 44 45 46 47 48 49 50 51 52 53 54 55 56 57 58 59 60 61 62 63 64 65 66 67 68 | %matplotlib inline import numpy as np from matplotlib import pyplot as plt import talib period = 14 obs = [10, 10.1, 9.92, 9.89, 9.19, 8.5, 8.96, 8.04, 7.67, 8.6, \ 8.72, 9.14, 10.03, 10.79, 11.39, 11.71, 11.1, 12.05, 11.21, 11.5, \ 12, 12.53, 12.59, 13.53, 12.87, 13.27, 13.72, 13.3, 13.88, 14.17, \ 14.77, 14.15, 13.75, 14.51, 13.57, 12.57, 13.02, 13.21, 12.41, 12.28, \ 11.41, 12, 11, 10.81, 10.07, 9.9, 9.77, 10.48, 11.38, 10.46, \ 10.28, 10.3, 10.78, 11.49, 12.27, 12.59, 12.74, 12.08, 11.19, 12.07, \ 13, 13.87, 13.15, 12.91, 13.19, 13.17, 12.24, 12.35, 12.43, 12.75, \ 11.97, 12.93, 13.73, 13.33, 13.74, 13.54, 14.23, 13.41, 12.52, 13.34, \ 14.06, 14, 13.83, 14.32, 15.18, 15.08, 14.86, 13.99, 13.48, 12.89, \ 13.17, 14.16, 13.5, 13.27, 13.62, 13.69, 13.4, 12.74, 13.09, 13.96] def RSI(data, n, isEMA=True): m = len(data)-1 k = 1/float(n) RSI = [None]*m # error handling for insufficient data if m<n: return RSI # compute 1 step price difference delta = [data[i+1]-data[i] for i in range(0,m)] # create the positive gains (up) and negative gains (down) series gain = [abs(i) if i>0 else 0 for i in delta] loss = [abs(i) if i<0 else 0 for i in delta] avg_gain = sum(gain[0:n])/float(n) avg_loss = sum(loss[0:n])/float(n) for i in range(n,m): # Exponential Moving Average if isEMA: avg_gain = gain[i]*k + avg_gain*(1-k) avg_loss = loss[i]*k + avg_loss*(1-k) # Simple Moving Average else: avg_gain = (avg_gain*n - gain[i-n] + gain[i])*k avg_loss = (avg_loss*n - loss[i-n] + loss[i])*k # calculate RSI value if avg_loss==0: RSI[i] = 100.0 else: RSI[i] = 100.0 - (100.0 / (1.0 + avg_gain/avg_loss)) return RSI # calculate RSI series RSI1 = talib.RSI(np.array(obs), period) RSI2 = RSI(obs, period) print("RSI1=",RSI1) print("RSI2=",RSI2) # plot x = np.array([i for i in range(len(obs))]) y = np.array([i for i in obs]) y2 = RSI1 plt.figure() plt.style.use(['dark_background']) fig, axs = plt.subplots(2) axs[0].set_title('Closing Price') axs[0].plot(x, y, linestyle='-', color='b') axs[1].set_title('RSI') axs[1].plot(x, y2, linestyle='-', color='g') plt.show() |
Result
Now, we have a better understanding about RSI! In the coming post, let's create an RSI strategy and see how useful it is.
Like and follow me
If you find my articles inspiring, like this post and follow me here to receive my latest updates.
Enter my promote code "AjpQDMOSmzG2" for any purchase on ALGOGENE, you will automatically get 5% discount.

