As title, how can I statistically test whether a given price series is random or not?
Appreciated if anyone can share some reference/ programming code.
PS: I don't have statistics background ...

There are many statistical research on this topic. You can look at "Wald–Wolfowitz runs test", which can be used to test whether the elements of a sequence are mutually independent.
From Wiki (https://en.wikipedia.org/wiki/Wald%E2%80%93Wolfowitz_runs_test),
"A run of a sequence is a maximal non-empty segment of the sequence consisting of adjacent equal elements. For example, the 22-element-long sequence
+ + + + − − − + + + − − + + + + + + − − − −
consists of 6 runs, 3 of which consist of "+" and the others of "−". The run test is based on the null hypothesis that each element in the sequence is independently drawn from the same distribution.
Under the null hypothesis, the number of runs in a sequence of N elements is a random variable whose conditional distribution given the observation of N+ positive values and N− negative values (N = N+ + N−) is approximately normal, with:

These parameters do not assume that the positive and negative elements have equal probabilities of occurring, but only assume that the elements are independent and identically distributed. If the number of runs is significantly higher or lower than expected, the hypothesis of statistical independence of the elements may be rejected."
Here I write a simple python function to calculate p-value.
from scipy.stats import norm

def run_test(arr, isbinary=False):
    n_pos, n_neg, n, runs = 0, 0, 0, 0
    # ensure at least 2 input observations
    if len(arr)<2:
        return None
    # step 1. convert a price series into (pos/neg)
    if isbinary:
        arr_run = arr
    else:
        arr_run = []
        for i in range(1,len(arr)):
            v = 1 if arr[i]>arr[i-1] else -1
            arr_run.append(v)
    # step 2. count pos/neg runs
    for i in range(0,len(arr_run)):
        if arr_run[i]>0:
            n_pos+=1
        elif arr_run[i]<0:
            n_neg+=1
        if i>1 and arr_run[i]!=arr_run[i-1]:
            runs+=1
    n = n_pos+n_neg
    # compute 2-tailed p-value
    mean = 2*n_pos*n_neg/float(n)+1
    sd = ((mean-1)*(mean-2)/float(n-1))**(0.5)
    prob = norm.cdf(runs, loc=mean, scale=sd)
    pval = min(prob,1-prob)
    return pval

# ------------------------------------
# TEST CASE
arr = [10, 11, 12, 13, 11, 12, 10, 11, 9, 11, 15, 16, 15, 13, 11, 10]
p = run_test(arr)
print("p_value = ",p)
Original Posted by - Jeremy:There are many statistical research on this topic. You can look at "Wald–Wolfowitz runs test", which can be used to test whether the elements of a sequence are mutually independent.
From Wiki (https://en.wikipedia.org/wiki/Wald%E2%80%93Wolfowitz_runs_test),
"A run of a sequence is a maximal non-empty segment of the sequence consisting of adjacent equal elements. For example, the 22-element-long sequence
+ + + + − − − + + + − − + + + + + + − − − −
consists of 6 runs, 3 of which consist of "+" and the others of "−". The run test is based on the null hypothesis that each element in the sequence is independently drawn from the same distribution.
Under the null hypothesis, the number of runs in a sequence of N elements is a random variable whose conditional distribution given the observation of N+ positive values and N− negative values (N = N+ + N−) is approximately normal, with:
These parameters do not assume that the positive and negative elements have equal probabilities of occurring, but only assume that the elements are independent and identically distributed. If the number of runs is significantly higher or lower than expected, the hypothesis of statistical independence of the elements may be rejected."
Python:
Here I write a simple python function to calculate p-value.
from scipy.stats import norm

def run_test(arr, isbinary=False):
    n_pos, n_neg, n, runs = 0, 0, 0, 0
    # ensure at least 2 input observations
    if len(arr)<2:
        return None
    # step 1. convert a price series into (pos/neg)
    if isbinary:
        arr_run = arr
    else:
        arr_run = []
        for i in range(1,len(arr)):
            v = 1 if arr[i]>arr[i-1] else -1
            arr_run.append(v)
    # step 2. count pos/neg runs
    for i in range(0,len(arr_run)):
        if arr_run[i]>0:
            n_pos+=1
        elif arr_run[i]<0:
            n_neg+=1
        if i>1 and arr_run[i]!=arr_run[i-1]:
            runs+=1
    n = n_pos+n_neg
    # compute 2-tailed p-value
    mean = 2*n_pos*n_neg/float(n)+1
    sd = ((mean-1)*(mean-2)/float(n-1))**(0.5)
    prob = norm.cdf(runs, loc=mean, scale=sd)
    pval = min(prob,1-prob)
    return pval

# ------------------------------------
# TEST CASE
arr = [10, 11, 12, 13, 11, 12, 10, 11, 9, 11, 15, 16, 15, 13, 11, 10]
p = run_test(arr)
print("p_value = ",p)
Original Posted by - Hiroki: Thanks for the reference!Can you explain how to interpret the function's output? Higher value means it is random?

Original Posted by - Jeremy:The hypothesis of run test is that:
- Null: a given dataset is random.
- Alternative: the dataset is non-random
My function computes the p-value which is usually compared to a significant level, say 5%.If p-value is less than 5%, then we have 95% confidence to say that the given sequence of dataset is non-random.
Run test just looks at directional moves (either increase or decrease), but ignore its magnitude.
Another approach is to test whether the time series is self-correlated or not. One of this kind of hypothesis tests is the Ljung–Box test (https://en.wikipedia.org/wiki/Ljung%E2%80%93Box_test). Instead of testing randomness at each distinct autocorrelation lag, it tests the "overall" randomness based on a number of lags
The Ljung–Box test is summarized below:
Hypothesis
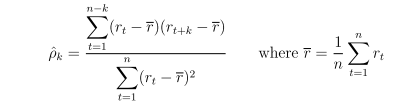
Lag k autocorrelation is denoted as
Sample autocorrelation coefficient is calculated as
Under H0, ρ0 = ρ1 = ... = ρM = 0. Test statistics is
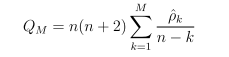
For large sample n, the test statistics Q asymptotically follows chi-square distribution 𝛘2(M)
For significant level α, the critical region for rejection of the hypothesis of randomness is:

Variance-Ratio Test of Random Walk is also applicable. Here's the idea.
Hypothesis H0: returns are indentially and independently distributed (i.i.d).
Under H0, we have
or expressed as variance ratio
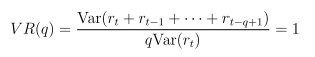
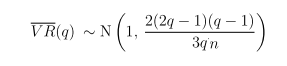
VR(q) can further be expressed as
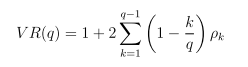
Under H0, for large sample n