
Are you a retail investor looking to make significant profits in the trading world? Many believe that you need vast capital or insider knowledge to succeed, but I've turned just $500 into an astounding $90,000 using nothing more than discipline, risk management, and nine simple chart patterns. Let's dive into how you can harness these patterns to boost your trading game!
My Trading Edge 🔑
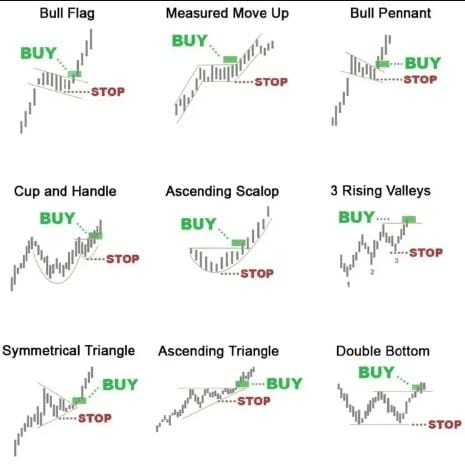
The key to my success was recognizing chart patterns that signal bullish breakouts. Instead of gambling on unpredictable meme coins, I focused on strategies that allowed me to manage risk effectively. Here are the nine chart patterns that played a crucial role in my trading journey:
1. Bull Flag 🚩
A strong upward movement followed by a small pullback forms a flag. This pattern indicates a continuation.
Action: Buy above the flag, place a stop-loss under it.
2. Measured Move Up 📏
After a price climb, the market consolidates before making another upward move of a similar size.
Action: Buy on breakout from consolidation, stop under base.
3. Bull Pennant 🔺
Similar to the Bull Flag, but the consolidation forms a triangular shape.
Action: Buy on breakout, stop-loss under the pennant.
4. Cup and Handle ☕
This pattern resembles a "U" shape followed by a slight dip (the handle).
Action: Buy above the handle's breakout, stop under the handle.
5. Ascending Scallop 🥄
A rounded upward curve that leads to a breakout.
Action: Buy breakout, stop-loss under the curve's low.
6. Three Rising Valleys ⛰️
This pattern consists of three consecutive higher lows.
Action: Buy on breakout above the last peak, stop under the third valley.
7. Symmetrical Triangle 🔻🔺
Price compresses within converging trendlines, signaling potential volatility.
Action: Buy above the upper trendline, stop below the pattern.
8. Ascending Triangle 📐
Here, you’ll find flat resistance on top and higher lows pushing from below.
Action: Buy above resistance, stop under the last higher low.
9. Double Bottom “W” 🟩
This pattern shows price testing support twice before bouncing back.
Action: Buy above the middle of the "W," stop under the second bottom.
How I Grew $500 into $90,000 🚀
By applying these patterns consistently, I transformed my initial investment of $500 into $90,000. Here’s how I did it:
- Risk Management: I risked only 2-3% of my account per trade, allowing me to withstand losses without significant damage to my capital.
- Compounding Wins: Small wins accumulated over time, gradually increasing my trading capital.
- Strategic Patterns: Trades like the Cup & Handle on Ethereum and the Ascending Triangle on Bitcoin provided massive gains. A single Double Bottom on ChainLink multiplied my account significantly.
The Psychology Behind Patterns
Understanding these patterns is not just about the charts; they reflect market psychology. They indicate when buyers are in control and when sellers are exhausted. By combining these insights with strict risk management, you can consistently capture explosive moves while safeguarding your capital.
Final Thoughts
If you're ready to take your trading to the next level, start by mastering these nine chart patterns. With the right mindset and disciplined approach, you too can turn a modest investment into life-changing wealth. Follow me and let’s grow together!
