Hyunjun Yoo

Question about close prices in function data and market data

Programming


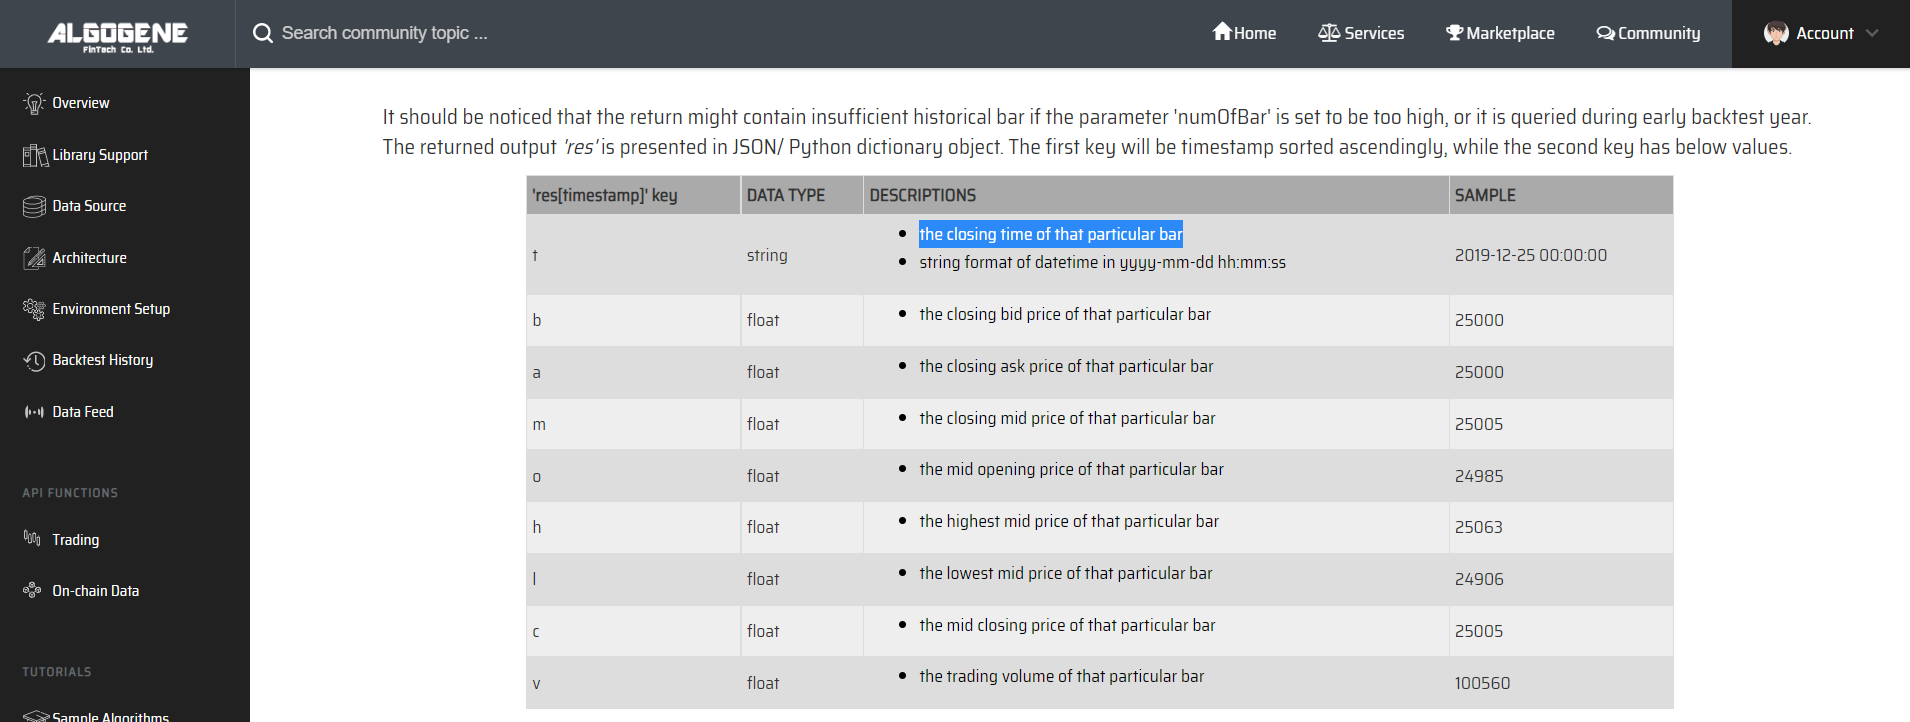
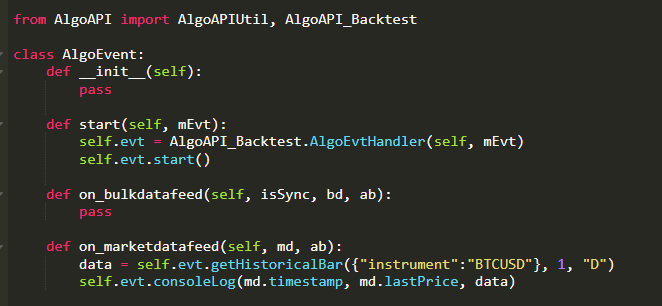
Hello, I have a confuse with difference between close price data in getHistoricalBar function and close price data in market data. I just tried to make a code to get RSI. But there was a quite big difference between real RSI data and mine. So I checked the close price data of each day. I found that there is a difference between the market data and function data. For example,  I set the settings like this. And I use the getHistoricalBar function like this to get close price.

close_prices = self.evt.getHistoricalBar({"instrument":self.myinstrument}, self.period+1, "D")

Start period : 2020-12
End period : 2020-12
Data Interval  : 1 day
Base Currency : USD
Instruments : BTCUSD

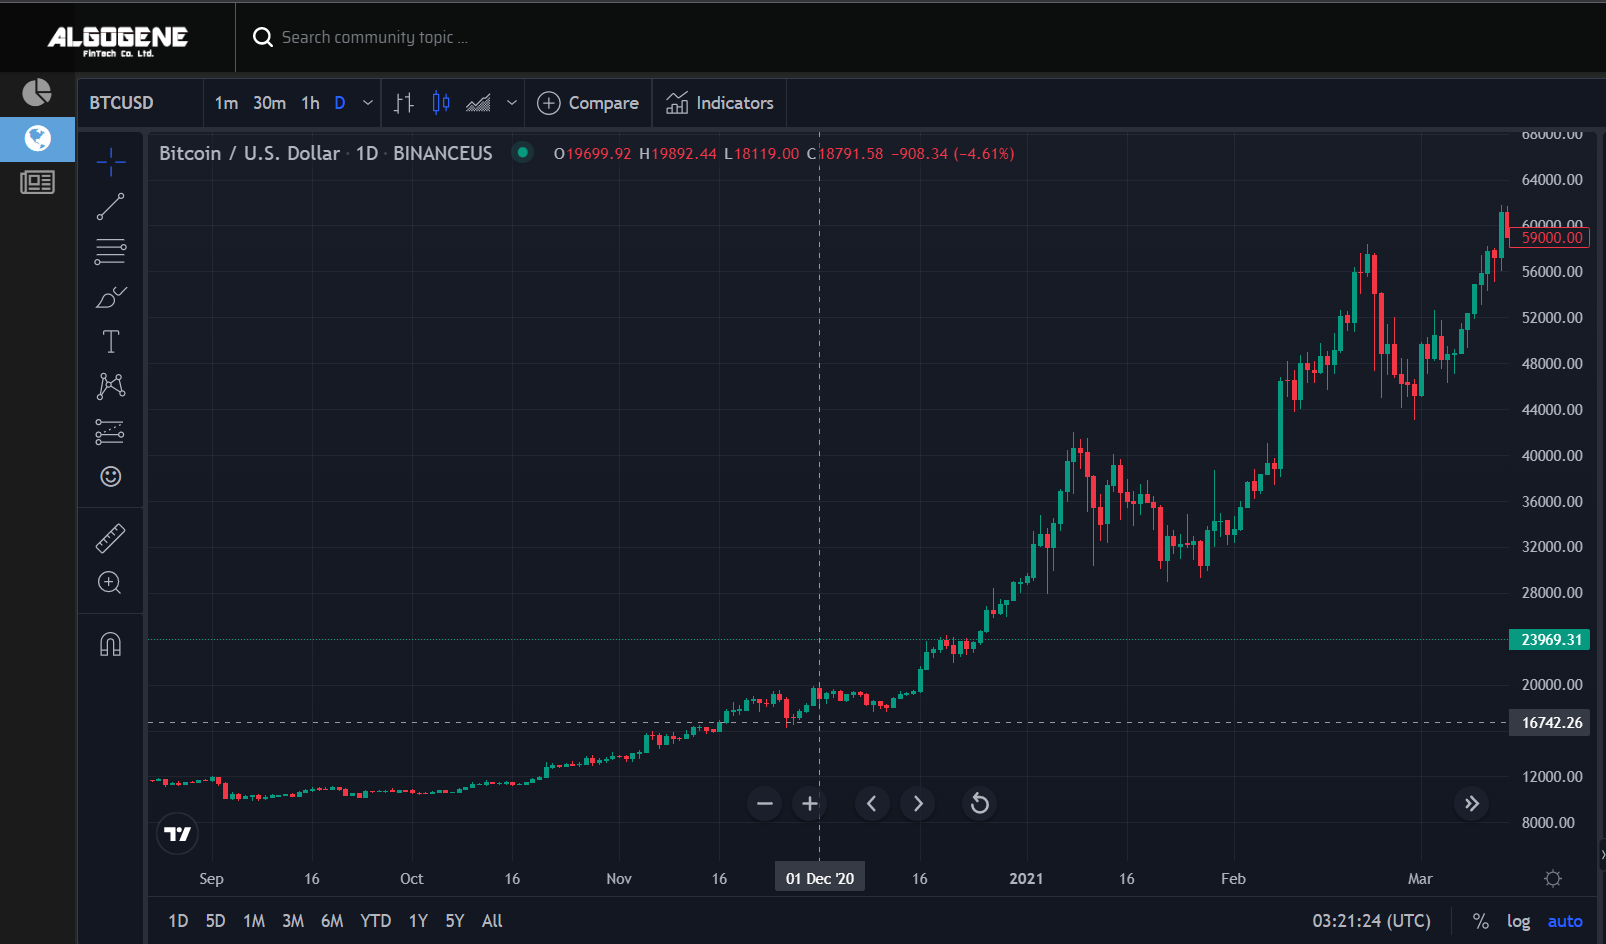
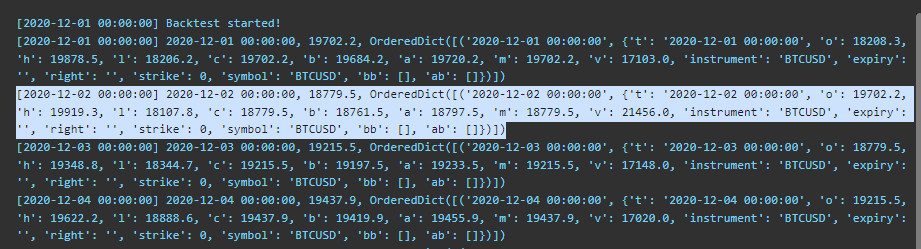
First, I get the close price 18208 in 2020-12-01. But in market analysis, this close price is in 2020-11-29. So there is a difference of about two days between the data. So, I just want to know why there is a difference.
Second, while following the close price, we found that the close price in the market data is not in the function data.
 
This is the close price I got. As you can see in this picture, there is no close price in 2020-12-05.
But in market analysis, the close price for that day is 18673. There seems to be a big difference in the value of RSI due to omitted data. What's wrong with these problems?

 
admin

It is related to the representation of timestamp for candles.

For many stock charts (eg. Yahoo Finance, TradingView, etc), timestamp usually refers to the opening time of a bar.

For example, this bar summarizes the price information from 1-Dec-2020 00:00:00 to 1-Dec-2020 23:59:59.


  • time: 1-Dec-2020
  • open price: 19699.92
  • high price: 19892.44
  • low price: 18119.00
  • close price: 18791.58

However, as mentioned in Tech Doc, ALGOGENE implemented "getHistoricalBar" using the closing time of a bar to prevent front-running problem.


Therefore, when we conduct backtest/ live-trading on the platform,


We can observe the full day info for 1-Dec only when the backtest time proceed to 2-Dec. Also, we should refer to the data with timestamp 2-Dec-2020 to compare with the chart above.

  • time: 2-Dec-2020
  • open price: 19702.2
  • high price: 19919.3
  • low price: 18107.8
  • close price: 18779.5


Hyunjun Yoo
Original Posted by - b'admin':

It is related to the representation of timestamp for candles.

For many stock charts (eg. Yahoo Finance, TradingView, etc), timestamp usually refers to the opening time of a bar.

For example, this bar summarizes the price information from 1-Dec-2020 00:00:00 to 1-Dec-2020 23:59:59.


  • time: 1-Dec-2020
  • open price: 19699.92
  • high price: 19892.44
  • low price: 18119.00
  • close price: 18791.58

However, as mentioned in Tech Doc, ALGOGENE implemented "getHistoricalBar" using the closing time of a bar to prevent front-running problem.


Therefore, when we conduct backtest/ live-trading on the platform,


We can observe the full day info for 1-Dec only when the backtest time proceed to 2-Dec. Also, we should refer to the data with timestamp 2-Dec-2020 to compare with the chart above.

  • time: 2-Dec-2020
  • open price: 19702.2
  • high price: 19919.3
  • low price: 18107.8
  • close price: 18779.5


Thank you for replying. I understand why there is a time term with backtest data and market data.
But I still confused with omitted data in backtest data. In case of my script in my picture, there is no closing price in 2020-12-05. Could you explain about this problem? Due to this problem, I always got quite big different RSI value.
 
admin
Original Posted by - b'Hyunjun Yoo': Thank you for replying. I understand why there is a time term with backtest data and market data.
But I still confused with omitted data in backtest data. In case of my script in my picture, there is no closing price in 2020-12-05. Could you explain about this problem? Due to this problem, I always got quite big different RSI value.
Hi Hyunjun, we have fixed the missing day issue. You can try again.