
What is Sharpe Ratio?
The Sharpe ratio was developed by William F. Sharpe, a Nobel laureate, to help investors understand the return on an investment in relation to its risk. The ratio measures the return earned in excess of the risk-free rate per unit of volatility or overall risk. It adjusts a portfolio return for the risk taken by the investor, and therefore, Sharpe Ratio is also called Risk-Adjusted Return.
How to calculate Sharpe Ratio?
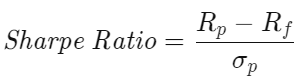
where
- Rp = return of portfolio
- Rf = risk free rate
- σp = volatility of the portfolio's return
In the formula above,
- Portfolio return is an annualized measurement which usually take the averagee of daily return and convert to an annualized return by multipling a factor of 252.
- Risk-free rate means the guaranteed return we can get from the financial market regardless of the market fluctuation. It is commonly chosen as the 1-year U.S. Treasury rate, the basic deposit rate from a bank saving account, or simply set to zero.
- Volatility is also an annualized measurement. It is calculated from the standard derivation of the portfolio's daily return, and multiply with a square root of 252.
- 252 is a rough estimation for the total number of trading day for Equity market in a year.
What does Sharpe Ratio tell you?
The higher a portfolio's Sharpe ratio, the better its risk-adjusted performance. If the calculation results in a negative Sharpe ratio, it either means the risk-free rate is greater than the portfolio’s return, or the portfolio's return is expected to be negative. For these case, a negative Sharpe ratio doesn't have useful meanings.
The Sharpe ratio makes performance comparison easy for different portfolio or fund. It helps explain whether a portfolio's excess returns are due to smart investment decisions or a result of high risk. Although a portfolio achieve a higher return than its peers, it is only a good investment if those higher returns do not come with an excess of additional risk.
What is a good Sharpe Ratio?
Let's go back to the Sharpe Ratio formula.
Assume risk-free rate is negligible (i.e. Rf = 0). Suppose we want our Sharpe Ratio to be greater than z. Then, we have
Remember that Rp is the porfolio mean return, and σp is the portfolio return's standard derivation.
This formula looks familiar, right? It is the lower bound of the confidence interval of a normal distribution!
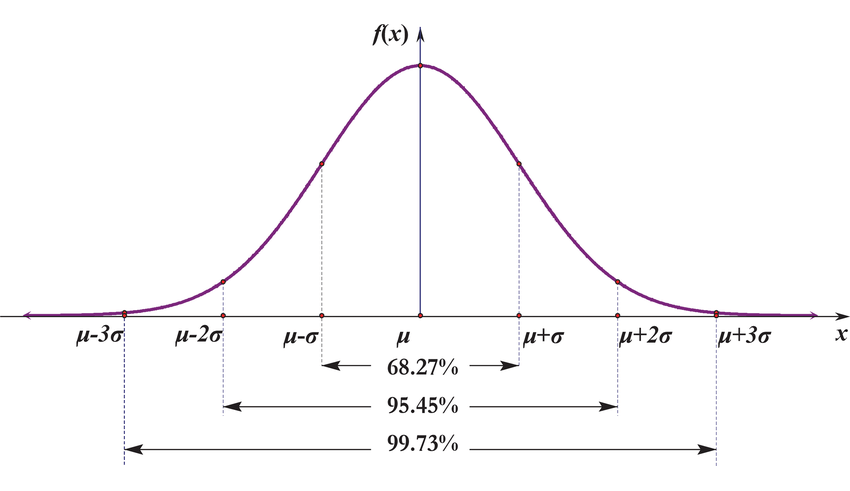
Assume the portfolio return is normally distributed. Then,
- For z = 1, we have 0.5 + 0.6827/2 = 84.14% probability for having positive return in a 1-year horizon.
- For z = 2, we have 0.5 + 0.9545/2 = 97.73% probability for having positive return in a 1-year horizon.
- For z = 3, we have 0.5 + 0.9973/2 = 99.87% probability for having positive return in a 1-year horizon.
In market practice, Sharpe ratios above 1.0 are generally considered “good," as it would suggest that the portfolio is offering excess returns relative to its volatility.
Limitation of Sharpe Ratio
- Sharpe ratio uses the standard deviation of returns in the denominator as proxy of total portfolio risk, which assumes that returns are normally distributed. However, in financial market, returns appear to have fat tail (i.e. statistically speaking high Kurtosis) because of a large number of surprising drops or spikes in prices.
- The use of standard deviation of returns as proxy of total risk implies that both positive and negative return are equally "risky". However, positive return is actually favorable to a portfolio. Therefore, there is a modified version (i.e. Sortino Ratio) for using the down side volatility measurement.
- Sharpe Ratio can be manipulated by fund manager. For example, the annualized standard deviation of daily returns is generally higher than that of weekly returns which is, in turn, higher than that of monthly returns. A fund manager can lengthen the measurement interval to produce a lower estimate of volatility.
