

Build Your First Sentiment Strategy: Psychological Line (PSY) in Python on ALGOGENE
Trading Strategy
Want a simple Bitcoin trading rule you can actually understand — and backtest on ALGOGENE in one afternoon? The Psychological Line (PSY) is a beginner-friendly market-sentiment indicator: it counts how many of the last N days closed higher than the day before, then turns that count into a percentage. No black-box model. No 20 indicators stacked on a chart. Just a crowd-mood score between 0 and 100.
This tutorial explains the PSY trading strategy in plain English, then walks through a complete long-only Python script for BTCUSD on the ALGOGENE platform. You will see how to pull daily bars, compute PSY, fire a buy when sentiment turns too weak, and close when it turns too strong — plus a real backtest equity curve you can compare against your own settings.
Psychological Line (PSY) = (number of up-days in the last N bars ÷ N) × 100. A reading near 0 means almost every recent day was down; near 100 means almost every day was up.
What is the Psychological Line (PSY) indicator?
PSY is a classic breadth-style oscillator used in technical analysis to measure short-term crowd psychology. If 9 of the last 12 daily closes were higher than the previous close, PSY is 75. If only 3 of those 12 days were up, PSY is 25.
Traders typically treat the extremes as overbought and oversold:
- High PSY (often 70–75+) — too many consecutive up-days; the crowd may be euphoric. Mean-reversion traders look to take profits or fade the move.
- Low PSY (often 25–30−) — too many down-days; fear may be stretched. Mean-reversion traders look for a bounce.
- Mid-range PSY — no extreme; this script stays flat and waits.
That is why PSY is a strong first indicator for beginners: the formula is one loop, the story is human (fear vs greed), and the signals map cleanly onto ALGOGENE’s event-driven backtest API.
PSY strategy rules used in this backtest
The script is long-only Bitcoin (BTCUSD) on daily bars. It does not short. It waits for PSY to cross a level — not merely sit below or above it — so a single print does not spam orders every bar.
- Lookback: 12 daily closes (plus one extra bar to compare yesterday vs today).
- Buy: when PSY crosses down through 30 (yesterday above 30, today below 30) and you are flat.
- Sell / close: when PSY crosses up through 70 (yesterday below 70, today above 70) and you are long.
- Size: a fixed 0.01 lot — easy to scale later.
- Optional risk: max hold of 20 days (platform auto-close), plus optional stop-loss / take-profit distances in price points.
Think of it as: buy when the crowd has been too pessimistic for a 12-day window, and get out when optimism looks stretched. That is a mean-reversion PSY strategy, not a trend-following one.
How to backtest a PSY strategy on ALGOGENE (beginner path)
- Log in to ALGOGENE and open the strategy editor (AlgoEvent template).
- Paste the Python class below. Keep
from AlgoAPI import AlgoAPIUtil, AlgoAPI_Backtestat the top. - Set the backtest instrument to BTCUSD, interval to daily (D), and a multi-year window (this example covers 2021 onward).
- Start with the defaults:
timeperiod = 12,psy_buy = 30,psy_sell = 70,volume = 0.01. - Run the backtest. Check the cumulative P&L chart, the net-position histogram, and the trade list before you change anything.
- Only then tweak one parameter at a time (lookback, 30/70 bands, hold time) so you can see what actually moved the result.
ALGOGENE will call on_bulkdatafeed as historical bars stream in. The script evaluates once per daily timestamp, asks for 14 daily candles via getHistoricalBar, computes PSY, and sends market orders through AlgoAPIUtil.OrderObject.
Walk through the Python script
You only need four moving parts to follow the code.
1. Parameters in __init__
myinstrument is BTCUSD. timeperiod is the PSY window. num_bar must be at least timeperiod + 1 so the last two PSY values exist for a crossover. max_hold_days converts to seconds on the order as holdtime. Leave sl_distance / tp_distance as None until you want hard stops.
2. PSY_cal — the indicator
For each bar i, count how many of the previous 12 closes were strictly higher than the close before them. Multiply by 100 / 12. The first timeperiod slots stay None (warm-up). That is the entire indicator — no TA library required.
3. on_bulkdatafeed — one decision per day
The script skips the bar if NAV is already ≤ 0, if the timestamp was already processed (last_tradeTime debounce), or if history is still shorter than 14 days. Then:
buy_signal= PSY[-2] > 30 and PSY[-1] < 30sell_signal= PSY[-2] < 70 and PSY[-1] > 70
Flat + buy signal → open_position(1, price). Long + sell signal → close_position().
4. Fills and position state
on_orderfeed stores tradeID on a successful open so you can close that exact trade later. on_openPositionfeed keeps net_pos in sync with the platform (1 / 0 / -1) so the strategy does not double-buy after a fill.
Full ALGOGENE PSY strategy code
Copy this into the ALGOGENE backtest editor as your AlgoEvent class.
1 2 3 4 5 6 7 8 9 10 11 12 13 14 15 16 17 18 19 20 21 22 23 24 25 26 27 28 29 30 31 32 33 34 35 36 37 38 39 40 41 42 43 44 45 46 47 48 49 50 51 52 53 54 55 56 57 58 59 60 61 62 63 64 65 66 67 68 69 70 71 72 73 74 75 76 77 78 79 80 81 82 83 84 85 86 87 88 89 90 91 92 93 94 95 96 97 98 99 100 101 102 103 104 105 106 107 108 109 110 111 | from AlgoAPI import AlgoAPIUtil, AlgoAPI_Backtest class AlgoEvent: def __init__(self): # ---- strategy parameters ---- self.myinstrument = 'BTCUSD' self.timeperiod = 12 # PSY lookback (daily bars) self.num_bar = 14 # bars requested (>= timeperiod+1) self.psy_buy = 30 # buy when PSY crosses DOWN through this self.psy_sell = 70 # close when PSY crosses UP through this self.volume = 0.01 # fixed size (replaces 1/n of the stock version) self.max_hold_days = 20 # 0 = disabled; else platform auto-close after N days self.sl_distance = None # optional absolute-price stop, e.g. 2000.0 self.tp_distance = None # optional absolute-price target # ---- internal state ---- self.last_tradeTime = None # debounce: evaluate once per daily bar self.trade_id = None self.net_pos = 0 # +1 long / 0 flat def start(self, mEvt): self.evt = AlgoAPI_Backtest.AlgoEvtHandler(self, mEvt) self.evt.start() # ---------------- helpers ---------------- def PSY_cal(self, prices, timeperiod=12): """Psychological line: % of up-days within the last `timeperiod` bars.""" PSY = [None] * len(prices) if len(prices) <= timeperiod: return PSY for i in range(timeperiod, len(prices)): up = 0 for j in range(timeperiod): if prices[i - j] > prices[i - j - 1]: up += 1 PSY[i] = 100.0 * up / timeperiod return PSY def open_position(self, buysell, price): order = AlgoAPIUtil.OrderObject() order.instrument = self.myinstrument order.openclose = 'open' order.buysell = buysell # 1 buy / -1 sell order.ordertype = 0 # market order.volume = self.volume if self.max_hold_days > 0: # max holding period (seconds) order.holdtime = self.max_hold_days * 24 * 3600 if self.sl_distance is not None: order.stopLossLevel = price - self.sl_distance if buysell == 1 else price + self.sl_distance if self.tp_distance is not None: order.takeProfitLevel = price + self.tp_distance if buysell == 1 else price - self.tp_distance self.evt.sendOrder(order) def close_position(self): if self.trade_id is None: return order = AlgoAPIUtil.OrderObject() order.tradeID = self.trade_id order.openclose = 'close' self.evt.sendOrder(order) self.trade_id = None # ---------------- callbacks ---------------- def on_bulkdatafeed(self, isSync, bd, ab): if self.myinstrument not in bd: return if ab and ab.get('NAV', 0) <= 0: return ts = bd[self.myinstrument]['timestamp'] if self.last_tradeTime == ts: # once per daily bar return self.last_tradeTime = ts contract = {"instrument": self.myinstrument} res = self.evt.getHistoricalBar(contract, self.num_bar, 'D') if len(res) < self.num_bar: # warm-up guard return closes = [res[t]['c'] for t in res] PSY = self.PSY_cal(closes, self.timeperiod) if PSY[-1] is None or PSY[-2] is None: return price = bd[self.myinstrument]['lastPrice'] buy_signal = PSY[-2] > self.psy_buy and PSY[-1] < self.psy_buy # cross down through 15 sell_signal = PSY[-2] < self.psy_sell and PSY[-1] > self.psy_sell # cross up through 85 if self.net_pos == 0 and buy_signal: self.open_position(1, price) elif self.net_pos > 0 and sell_signal: self.close_position() def on_orderfeed(self, of): if of.status == 'success' and of.openclose == 'open': self.trade_id = of.tradeID self.evt.consoleLog('open fill', of.instrument, of.fill_price, of.fill_volume) elif of.status in ('reject', 'kill'): self.evt.consoleLog('order failed', of.status, of.instrument) self.trade_id = None def on_openPositionfeed(self, op, oo, uo): if self.myinstrument in op: netv = op[self.myinstrument]['netVolume'] self.net_pos = 1 if netv > 0 else (-1 if netv < 0 else 0) else: self.net_pos = 0 self.trade_id = None def on_dailyPLfeed(self, pl): pass |
Backtest result: BTCUSD PSY (12, 30/70)
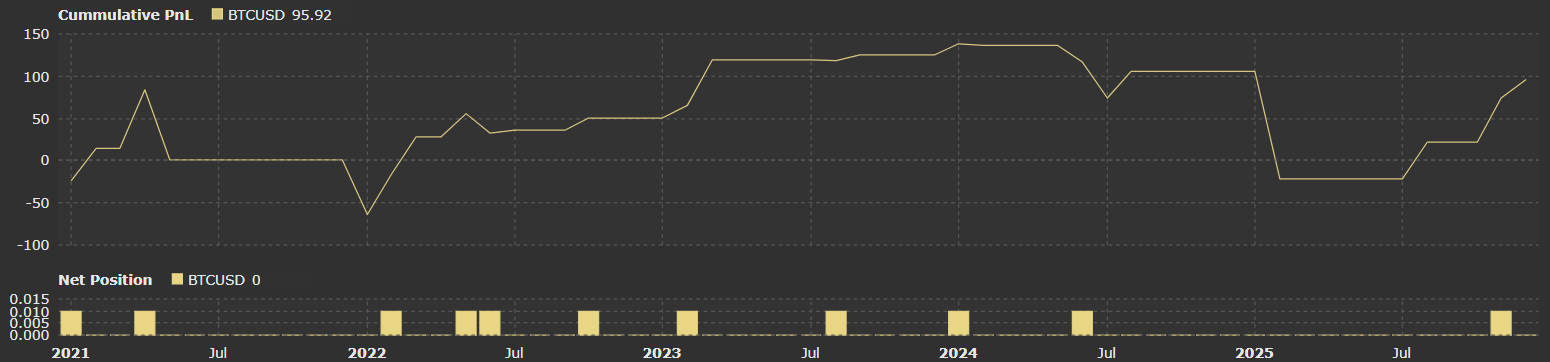
The chart below is a long-only PSY backtest on BTCUSD using the script above. Cumulative P&L finished around +95.92 over 2021–2025, with a sparse net-position histogram — the strategy is selective, not always in the market.
Read the path, not just the end number. There is a sharp dip into 2022, a long grind higher into 2024, another drawdown in 2025, then a recovery. That is typical of a mean-reversion rule on a trending crypto: it can harvest oversold bounces, then give back profits when Bitcoin trends hard and PSY stays extreme longer than 12 days.
Suggested backtest panel settings to reproduce this style of run:
- Instrument: BTCUSD
- Bar interval: Daily (D)
- PSY lookback: 12
- Buy cross: 30 down / Sell cross: 70 up
- Volume: 0.01
- Max hold: 20 days (optional)
- Short selling: off
How to improve the PSY Bitcoin strategy next
- Change the window. Try 10, 12, and 20. Shorter PSY is noisier; longer PSY is slower to call extremes.
- Move the bands. 25/75 is stricter (fewer trades). 35/65 is looser (more trades, more whipsaws).
- Turn on stops. Set
sl_distance/tp_distancein price points if you do not want to wait for a 70-cross. - Filter the trend. Skip buys when a 50-day moving average is still falling — a common way to avoid catching falling knives in a bear market.
- Do not fit one chart. If you optimize 30/70 on this equity curve alone, you are fitting 2021–2025 Bitcoin, not discovering a law of nature. Walk-forward or a second symbol (ETHUSD) is the honest next test.
FAQ: Psychological Line (PSY) on ALGOGENE
What is the Psychological Line indicator in simple terms?
It is the percentage of recent bars that closed up versus the previous bar. PSY(12) = 50 means six of the last twelve daily closes were up-days.
Is PSY the same as RSI?
No. RSI weights the size of gains and losses. PSY only counts up-days versus down-days. PSY is easier to code by hand, which is why it is a good first ALGOGENE project.
Why buy when PSY crosses down through 30 instead of when it is simply below 30?
A cross is an event. “Below 30” is a state that can last many days. Using a cross keeps the bot from sending a new buy order on every daily bar while PSY stays oversold.
Can I use this PSY script for stocks or gold?
Yes. Change self.myinstrument (for example to XAUUSD or a stock ticker your ALGOGENE account supports) and re-run the daily backtest. Recalibrate volume and optional stop distances — Bitcoin’s dollar range is not Gold’s.
Does this backtest guarantee future profit?
No. The +95.92 path is one historical sample with one parameter set. Use it to learn the ALGOGENE workflow — historical bars, crossovers, sendOrder — not as a live-trading promise.
Wrap up
The Psychological Line is one of the few indicators you can explain in a sentence and implement without a library. On ALGOGENE, that maps to a short AlgoEvent: compute PSY from daily closes, buy the down-cross of 30, exit the up-cross of 70, and let the backtest engine show you whether crowd psychology was tradable on BTCUSD.
Paste the script, run the daily backtest, then change one number. That loop — idea → code → chart → tweak — is the whole beginner path. Share your lookback and band settings in the comments if you beat (or break) the curve above.
Happy backtesting.